Dependency Graph
Visualize your codebase dependencies.
Understanding the graph
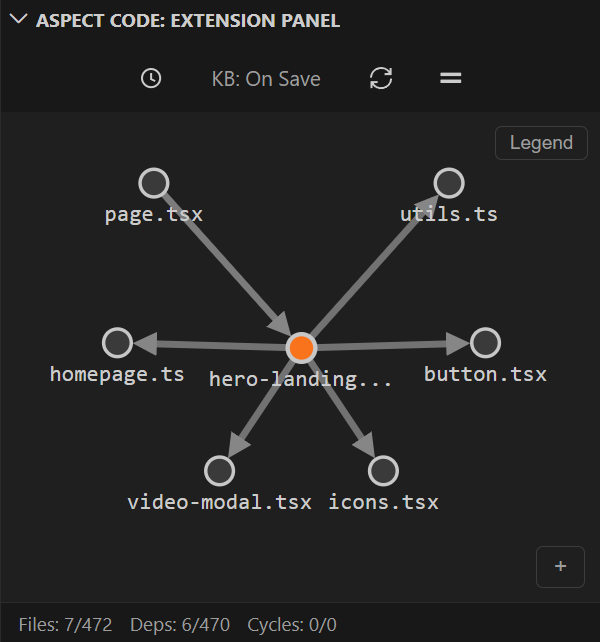
The dependency graph provides a visual representation of your codebase structure.
Interacting with the graph
Reading the stats
Files: 7/472 — 7 files shown in current view out of 472 totalDeps: 6/470 — 6 dependencies shown out of 470 totalCycles: 0/0 — No circular dependencies detectedFiles with many incoming connections are hub modules—changes to these affect many other files.